London Bike Journey Analysis
Tools: R · RStudio · R Markdown · ggplot2 (visualisations)
This analysis of London’s Santander Cycles data for August 2023 reveals several clear patterns: the median trip duration is approximately 14 minutes, with weekend journeys averaging longer than weekday ones — suggesting a shift from commuting to leisure use.
A small number of central London stations dominate demand, particularly those near major transport hubs and tourist areas.
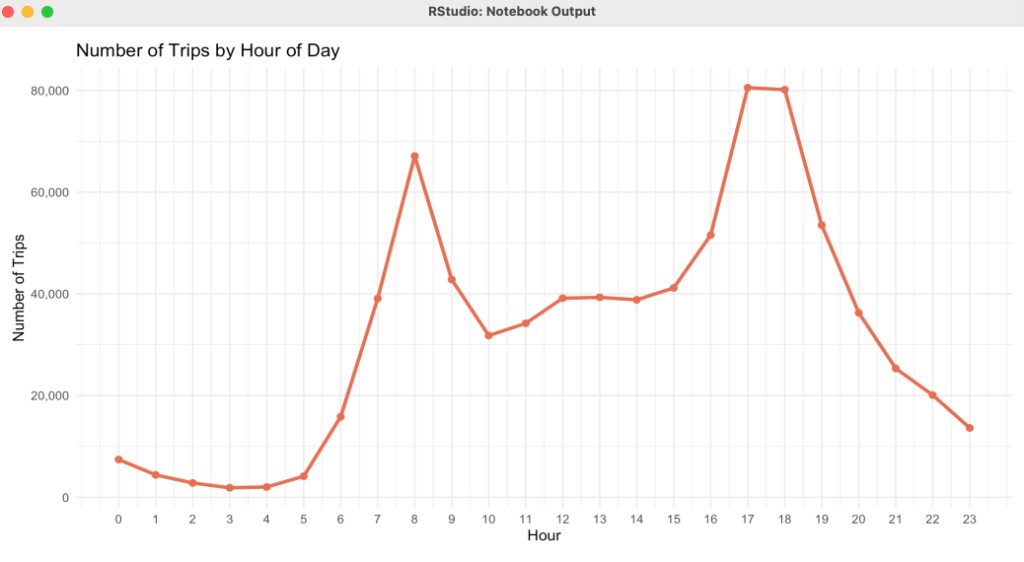
Usage follows a clear double-peak pattern on weekdays (8–9am and 5–6pm), while weekends show a flatter, midday-centred distribution.
These insights could help TfL optimise bike redistribution, prioritise dock maintenance, and plan capacity during peak periods.
The work is documented as a knitted R Markdown report, with reproducible code and charts suitable for stakeholder-style storytelling.